Back to: Trading with Smart Money
Volume Spread Analysis (VSA): The Secret of Professional Traders
Introduction to Volume Spread Analysis

“Hey traders! 👋 Have you ever wondered how professional traders seem to predict market moves so accurately? Their secret weapon is Volume Spread Analysis, or VSA. In today’s article, I’ll show you how to combine volume, price action, and candlestick patterns to understand exactly what the smart money is doing—and how you can profit from it.
✨In this comprehensive guide, you’ll discover:
- How Volume Spread Analysis (VSA) works.
- How smart money uses volume to manipulate markets.
- Proven VSA trading strategies that lead to consistent profits.
💡By the end of this article, you’ll be reading charts like a professional—seeing what others can’t.
🌟Table of Contents
- Introduction
- What is Volume Spread Analysis (VSA)?
- Why VSA is the Key to Smart Money Trading
- Core Concepts of Volume Spread Analysis
- Volume
- Price Spread
- Closing Price
- How to Read Volume and Spread Like a Pro
- Key VSA Patterns Every Trader Should Know
- No Demand Bar
- No Supply Bar
- Stopping Volume
- Climactic Action
- VSA Trading Strategies for Profitable Trades
- Common Mistakes in VSA and How to Avoid Them
- Pro Tips for Mastering Volume Spread Analysis
- Conclusion
- FAQs
What is Volume Spread Analysis (VSA)?
Volume Spread Analysis, or VSA, is a method that helps traders understand the activity of institutional players by analyzing three key elements: PRICE, VOLUME, and SPREAD (the difference between high and low of a candle). The goal? To detect whether smart money is accumulating, distributing, or manipulating price movements.
Volume Spread Analysis is a trading technique that reveals the hidden intentions of big institutions and smart money.
Key Elements of Volume Spread Analysis
To use VSA effectively, analyze these three factors together:

Volume
The activity level → How much trading activity is happening
- High volume → Institutions are active.
- Low volume → Lack of interest, weak trend.
Price Spread (Range of the Candle)
The price movement range
- Wide spread + High volume → Strong move.
- Narrow spread + High volume → Possible reversal.
Closing Price Position
Where the price closed relative to the range
- Close near high → Strength.
- Close near low → Weakness.
- Middle close → Indecision.
Tip: The best trades happen when all three elements align!
🎤 “Understanding how these three factors interact allows you to spot market manipulation, identify trend reversals, and enter trades with high confidence.”
✨Unlike traditional technical analysis, VSA focuses on what the smart money is doing, not what indicators say.
The 4 Market Phases in Volume Spread Analysis
The market follows four key phases in Volume Spread Analysis:
📌 1. Accumulation (Smart Money Buying)
- Happens at market bottoms.
- Volume spikes, but price stays low.
- No demand bars appear (small candles with low volume).
📌 2. Markup (Uptrend Begins)
- Price starts rising as institutions increase their buying.
- Volume increases on up moves.
- Pullbacks have low volume (healthy trend).
📌 3. Distribution (Smart Money Selling)
- Happens at market tops.
- High volume, but no new highs.
- Upthrust bars appear (wide spreads but close near lows).
📌 4. Markdown (Downtrend Begins)
- Price collapses as smart money dumps positions.
- Volume rises on down moves.
- Pullbacks show low volume.

Strength of the candle based on the close and spread.

Ranks candles from most bullish to most bearish based on their structure:
- The green arrow on the left shows increasing bullish strength.
- The red arrow on the right shows increasing bearish strength.
- The middle of the chart (black candle) represents neutral or indecisive sentiment.
But now check the meaning of candle change some time if using volume.

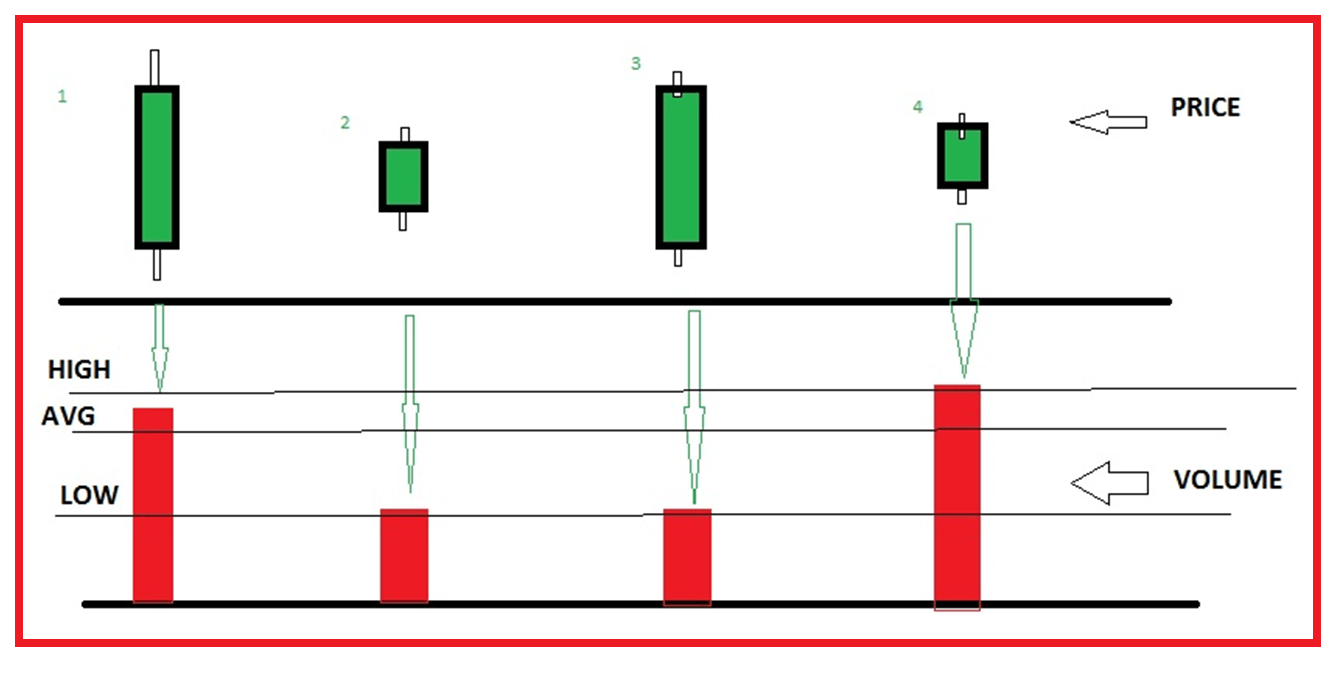
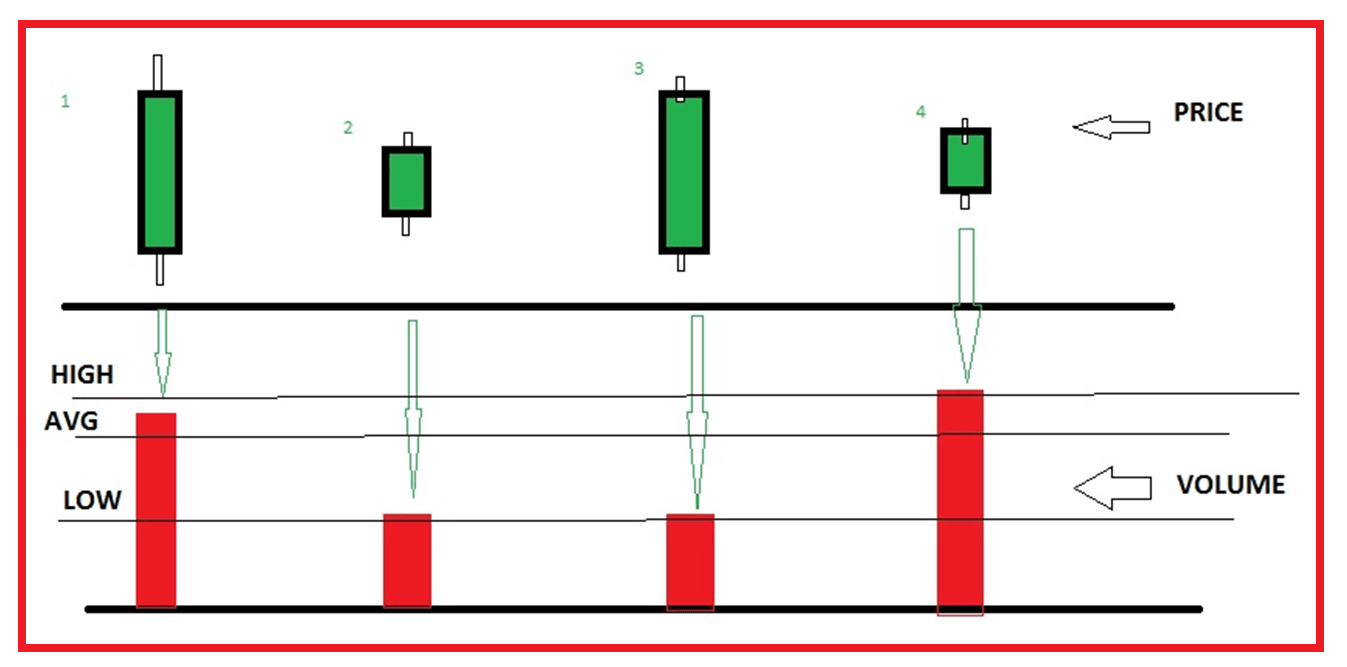
If the volume is high with a narrow candle, smart money might be selling into retail buying — a reversal could be near or observing supply at resistance.
Why VSA Matters
Why VSA is the Key to Smart Money Trading: Professional traders and institutions use volume to hide their intentions. But when you understand VSA, you can spot the footprints they leave behind.

In the above chart, the price broke out of the range with volume and moving up, but faced supply. In VSA, it’s called the stopping volume. And you would exit by seeing this
🎤Key Reasons Why VSA Works:
✔️Detects smart money moves before the crowd. Understanding VSA allows you to trade with smart money, not against it. They leave footprints in the form of volume spikes and price spread reactions.
✔️Helps avoid false breakouts. Smart money needs liquidity—they create fake moves to trap retail traders. Spot false breakouts, trend reversals, and breakout continuations like a pro.
✔️Confirms the strength or weakness behind price moves. Volume + Spread reveals who’s controlling the market.
🎤 While retail traders react, smart money accumulates and distributes positions silently—VSA exposes their moves. With VSA, you don’t just react—you predict.
The 4 Key Principles of VSA
🎤 Let’s break down the four core principles of Volume Spread Analysis.
🔥1. Effort vs. Result
🎤 “When there’s a large spike in volume, the price should move significantly. If it doesn’t, something’s off.”
If the volume is high with a narrow candle, smart money might be selling into retail buying — a reversal could be near or observing supply at resistance.

🎯 Effort (Volume) Should Match the Result (Price Movement)
- Strong Volume + Strong Price Move = Valid Trend. Or a valid breakout
- Strong Volume + No Price Move = Possible Reversal (Smart Money Trap). End of trend
- Low Volume + Big Move = Weak Move (Likely to Fail).
- Strong Volume + reversal pattern at support = valid reversal


📈2. Harmony and Divergence in trend
🎤 “Harmony occurs when price and volume move together. Divergence happens when price moves up, but volume drops—this shows weakness.”
- 💡If price moves up but volume decreases, the uptrend is weak and likely to reverse! Or goes to larger consolidation


🚨3. Climactic Volume and Signals end of trend
🎤 Volume spikes at the end of a movement can indicate market tops or bottoms. Example: A sudden surge in volume with a long wick candle suggests exhaustion, buyers or sellers are being taken out.

🔄4. Testing Volume
🎤Market test supply for an up move. If there is no supply after a strong bullish candle, the price will increase. Any low volume test of support resistance is expected to reversal
- 📌 Example: Price testing previous highs with dropping volume.
- 💬Key Insight: “Low volume tests are powerful entry points for reversals.”
If a stock begins moving higher and reacts, and has a narrower price spread
and lower volume than the previous two candles, that suggests a lack of supply.
Price will move against the weakness.

🟩1. No Demand Bar (Bearish Signal)
- Structure: Narrow spread, closes mid-bar or low, with lower volume than the previous two bars.
- Interpretation: Lack of buying interest—expect a downtrend.
- 💡Sell on confirmation from the next bearish candle.
🟥2. No Supply Bar (Bullish Signal)
- Structure: Narrow spread, closes mid-bar or high, with lower volume than the previous two bars.
- Interpretation: Lack of selling interest—expect an uptrend.
- 💡Buy on confirmation from the next bullish candle.

How to Use VSA for Trading Entries
Now that we know how to read smart money signals, let’s dive into actionable trading strategies you can use!
🎤 “Let’s talk about how to use VSA for your trading entries.”
⚡1. Trend Reversal Strategy Using Volume Spike
- Setup: Wait for a high-volume reversal candlestick pattern at key support or after an extended trend.
- Entry: Buy on bullish confirmation candle.
- Stop-loss: Below the stopping volume candle’s low.
- Take-profit: At the next resistance level.
- Support Zone: High volume + bullish reversal = smart money buying.
- Resistance Zone: High volume + bearish reversal = smart money selling.

⚡2. Breakout Strategy Using Wide Spread Bars
- Setup: Identify consolidation zones.
- Entry: Enter after a wide spread bullish bar with high volume closes above resistance.
- Stop-loss: Below the breakout candle.
- Take-profit: Ride the trend with a trailing stop.
- Above resistance +Wide Spread + High Volume: Breakout confirmation.
- Above resistance +Narrow Spread + low Volume: Potential reversal—watch for next candle confirmation.

⚡3. Continuation Strategy with No Supply/No Demand Bars
- Setup: In an uptrend, watch for no supply bars during pullbacks. prefer after the breakout
- Entry: Enter long after confirmation of bullish continuation/bullish reversal with volume.
- Stop-loss: Below the pullback low.

Chart Analysis with VSA
🎤 “Now, let’s jump into a chart analysis and apply what we’ve learned.”
Analysis Process:
✅Step 1: Identify Key Levels
- Mark major support and resistance levels.Trendlines or moving averages
✅Step 2: Analyze Volume and Spread at These Levels
- Is there harmony or divergence? Is the market testing these levels on low volume or high volume?”
- Support Zone: High volume + bullish reversal = smart money buying.
- Resistance Zone: High volume + bearish reversal = smart money selling.
- Above resistance +Wide Spread + High Volume: Breakout confirmation.
- Above resistance +Narrow Spread + low Volume: Potential reversal—watch for next candle confirmation.
✅Step 3: Confirm with Candlestick Patterns
- Combine VSA with candlestick signals like pin bars, hammers, or engulfing patterns for high-probability trades.
✅Step 4
- Plan entry, stop-loss, and take-profit levels.
- Discuss risk/reward ratios and trade management.
Common Mistakes in VSA and How to Avoid Them
❌Ignoring Context: Always analyse volume and spread in the context of the trend.
❌Overlooking Multiple Timeframes: Confirm VSA signals on higher timeframes.
❌Neglecting Market News: High-impact news can distort volume—be cautious.
❌Relying on Single Bars: Always wait for confirmation bars before trading.
🌟Pro Tips for Mastering Volume Spread Analysis
✅ Combine VSA with price action analysis for stronger signals.
✅ Use multi-timeframe analysis for accurate entries.
✅Backtest VSA strategies to build confidence.
✅Volume spikes without price movement = accumulation/distribution.
✅Always have a risk management plan—VSA shows probability, not certainty.
📌 Recap & Final Thoughts
Volume Spread Analysis (VSA) is a powerful tool that reveals the hidden actions of smart money. You’ll gain an unfair advantage in the market by mastering the relationship between volume, price spread, and closing price.
🔥Start trading like the professionals—stop guessing and follow the smart money.
✔️ Volume confirms or contradicts price movements.
✔️ Harmony means trend continuation; divergence signals weakness.
✔️ Use volume spikes and tests for high-probability entries.
✔️Always combine VSA with price action and candlestick patterns.
🎤 “Volume Spread Analysis takes practice, but once mastered, it becomes a powerful weapon in your trading arsenal.“
❓FAQs
🔹What is Volume Spread Analysis (VSA)?
VSA is a trading method that examines the relationship between volume, price spread, and closing price to reveal market sentiment and smart money activity.
🔹Is VSA effective for all markets?
Yes! VSA works on forex, stocks, crypto, and commodities as long as volume data is available.
🔹How do I use VSA for breakout trading?
- Look for widespread bars with high volume breaking key levels.
- Confirm with the closing price in the upper half for bullish breakouts.
🔹What are the best timeframes for VSA?
- Scalping: 5M, 15M charts.
- Swing Trading: 1H, 4H charts.
- Position Trading: Daily, Weekly charts.
To learn more in-depth about Volume Spread Analysis – The Secret of Professional Traders in Trading, please check the following video on our YouTube channel.
In this article, I explain Volume Spread Analysis – The Secret of Professional Traders in trading. I hope you enjoy this article and better understand Volume Spread Analysis – The Secret of Professional Traders in Trading. Please join my Telegram Channel, YouTube Channel, and Facebook Group to learn more and clear your doubts.
