Back to: Trading with Smart Money
RSI (Relative Strength Index) Trading Strategy
In this article, I will discuss the RSI indicator, the Relative Strength Index (RSI) Trading Strategy. Please read our previous article discussing Option Chain Analysis in Trading. As part of this article, you will learn the following.
- What is RSI?
- How Does the RSI Indicator Work?
- 4 Uses of RSI
What is the Relative Strength Index?
J. Welles Wilder developed the Relative Strength Index (RSI). Relative Strength Index (RSI) is a momentum oscillator that measures the speed and change of price movements. The RSI oscillates between zero and 100. The Relative Strength Index (RSI) is a popular momentum oscillator used in technical analysis to measure the speed and change of price movements.
How Does the RSI Indicator Work?
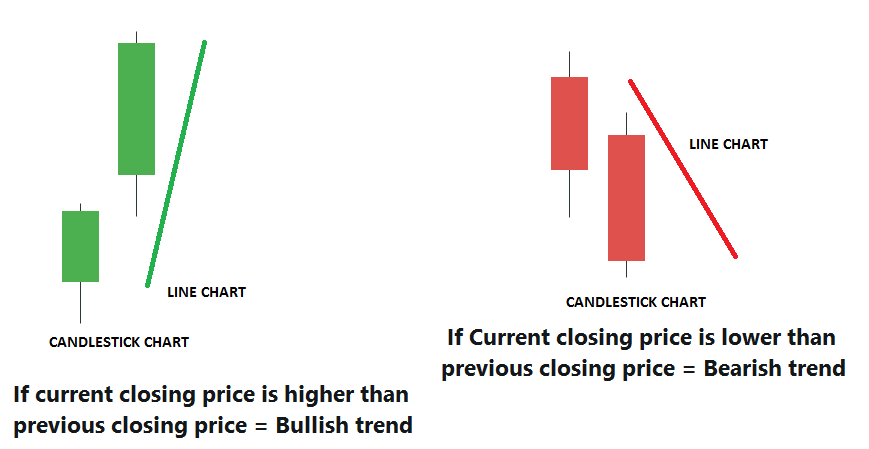
Let’s understand the formula. How does it work? The logic behind the RSI. The RSI indicator is calculated on the closing price. We can define bullish and bearish prices on a closing chart as follows:
- If the current closing price is higher than the previous closing price, = Bullish trend
- If the Current closing price is lower than the previous closing price, = Bearish trend

The first calculations for average gain and loss are simple 14-period averages(default period). The first question is, what is the average gain? Let me give you a very simple example.

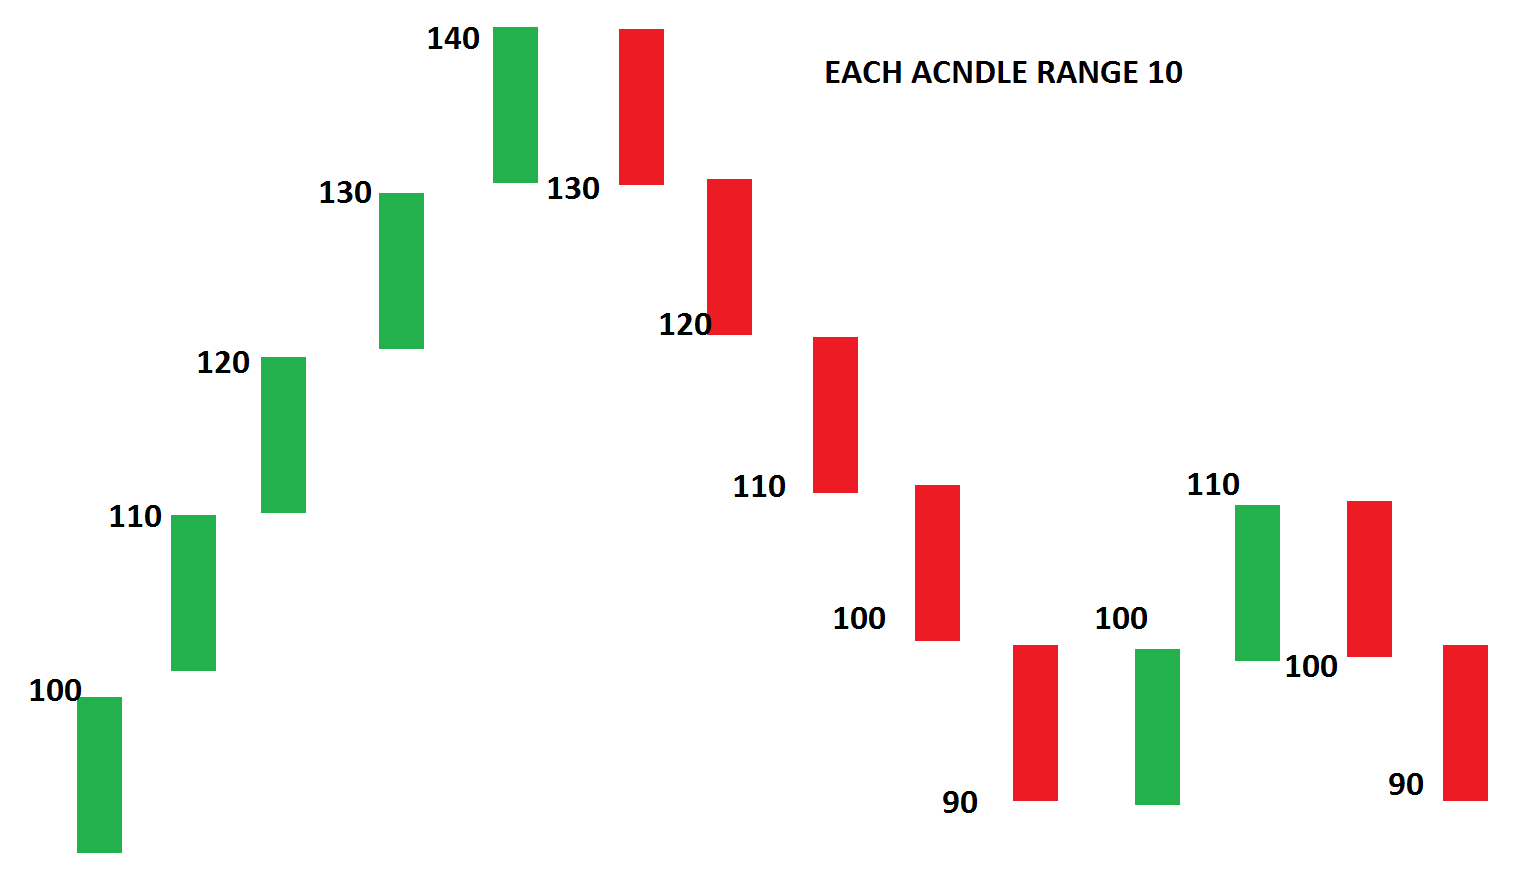
Above is a chart connecting 14 closing prices. We are calculating the average gain and loss over the last 14 periods. Let us calculate gains and losses using this chart.
- First Average Gain = Sum of Gains over the past 14 periods
- First Average Loss = Sum of Losses over the past 14 periods
In the above chart,
Bullish readings (Gain) are = 10,10,10,10,10,10 and 10
Bearish reading (Loss) are = 10,10,10,10,10,10 and 10
Let us calculate the simple average price of the gains & losses:
Bullish average = (10+10+10+10+10+10+10)/7=10
Bearish average = (10+10+10+10+10+10+10)/7=10
So average gains were 10 points and average losses 10 points.
How do we know how strong the bulls are?
The average of losing bars plus the average of winning bars was =10+10=20
The average gain was 10
So, RSI will be (10 / 20) x 100= 50
The key thing to note is that the higher your average gain, the higher your RSI will be. Make sense?
Suppose in the above example, the average gain is 15 and the average loss is 5
RSI will be (15/20) x 100= 75
So, when the RSI is at 50, the Average gain equals the Average loss.
RSI goes up: When your average gain is greater than your average loss in a particular lookback period, this pretty much means that the size of your bullish candles is larger than the bearish ones.
RSI goes down: When your average gains are smaller than your average loss in a particular look-back period. This means the size of bearish candles is larger than the bullish candles. In other words, the RSI indicator measures the momentum of price or trend.
(Disclaimer: I used a very simplified version of the Relative Strength Index (RSI) indicator calculation. I think their calculation is a little bit more complicated. But again, the concept is the same.)
Parameters
The default look-back period for RSI is 14, but this can be changed. The look-back period for RSI is lowered to increase sensitivity or raised to decrease sensitivity. 7- Period RSI is more likely to reach overbought or oversold levels than 14- period RSI.
Uses of Relative Strength Index Trading Strategy
RSI shows overbought or oversold
- RSI is when above 70 and oversold when below 30. These levels can also be changed if necessary to fit the security better. For example, if security repeatedly reaches the oversold level of 30, you may want to adjust this level to 20.
- Relative Strength Index (RSI) overbought and oversold readings work best when prices move sideways within a range.
- During strong up trends, the RSI may remain overbought for extended periods.
So consider only oversold when the trend is strong. Reverse for a strong downtrend.

RSI pattern
- RSI also often forms chart patterns(like price chart patterns) that may not show on the underlying price chart, such as double tops and bottoms, support resistance, and trend lines.
Identifying Trends Using RSI
Uptrend
Suppose the RSI is above 50. This tells you that the average gain is larger than the average loss. You can conclude that it’s in an uptrend. In an uptrend, the RSI tends to remain in the 40 to 80 range, with the 40-50 zone acting as a support zone.
Downtrend
If the RSI is below 50. This tells you that the average loss is greater than the average gain, and you can conclude that it’s in a downtrend
During a downtrend, the RSI tends to stay between the 20 to 60 range, with the 50-60 zone acting as a resistance zone. These ranges will vary depending on the RSI settings and the strength of the security’s trend.
DIVERGENCE
This divergence can signal a price reversal if prices make a new high or low that the RSI doesn’t confirm.
Price makes a lower low while RSI makes a higher low. Why?
A bullish divergence occurs when the price makes a lower low, and RSI forms a higher low. If the RSI does not confirm the lower low, this shows strengthening momentum. It means there were gains in between while the price made new lows, but the gains prevented the RSI from making a corresponding lower low. The logic is reversed for the Bearish divergence.


In the next article, I will discuss the BTST Trading Strategy (Buy Today, Sell Tomorrow). In this article, I try to explain the RSI Trading Strategy. I hope you enjoy this RSI Trading Strategy article. Please join my Telegram Channel, YouTube Channel, and Facebook Group to learn more and clear your doubts.
Registration Open – Microservices with ASP.NET Core Web API
Session Time: 6:30 AM – 8:00 AM IST
Advance your career with our expert-led, hands-on live training program. Get complete course details, the syllabus, registration, and Zoom credentials for demo sessions via the links below.

IS THIS COURSE IS PAID?
sir, kindly share MACD STRATEGY ARTICLE&OBLIGE
Sir please make a video of this RSI strategy for more details on YouTube
Nice explain Keep continue 👌👌👌
Nice 👍