Back to: Trading with Smart Money
Multiple Timeframe Analysis for Intraday Trading
In this article, I will discuss Multiple TimeFrame Analysis for Intraday Trading in detail. Please read our previous article, where we discussed the Intraday Trading Course. We will also discuss the following pointers in detail.
- What is multiple timeframe analysis?
- Understanding the trend with multiple timeframe analysis
- How to use multiple time frames in trading
- Advantages of multiple timeframe analysis
Multiple timeframe analysis for intraday trading
Have you ever taken a picture-perfect setup on your primary timeframe chart only to see if it does not work and stop you? Traders should always understand the overall market environment, not just a one-time frame.
The advantages of using multiple time frames that we cover include:
- Allowing the trader to get a micro view of larger time frames can, in turn, confirm the trader’s original trade analysis. It is like using a backup pattern and fine-tuning an entry. An example would be having a pattern on a 60-minute chart and using a 5-minute chart to confirm the entry.
- Combining time frames can manage risk more effectively. A trader can learn to move stops on smaller time frames for patterns that complete on larger ones.
- Using multiple time frames from larger to smaller can help the trader be aware of contrary or opposing patterns that form on smaller time frames against the longer-term time frame.
Let’s take the day trading example.
We will use 3-time frames for our decision-making
- Higher Time Frame (HTF) DAILY
- Intermediate Time Frame(ITF) HOURLY
- Trading Time Frame(TTF) 5MINUTES
Higher Time Frame (HTF) DAILY
The daily time frame for market overview and stock selection
FOR STOCK selection based on
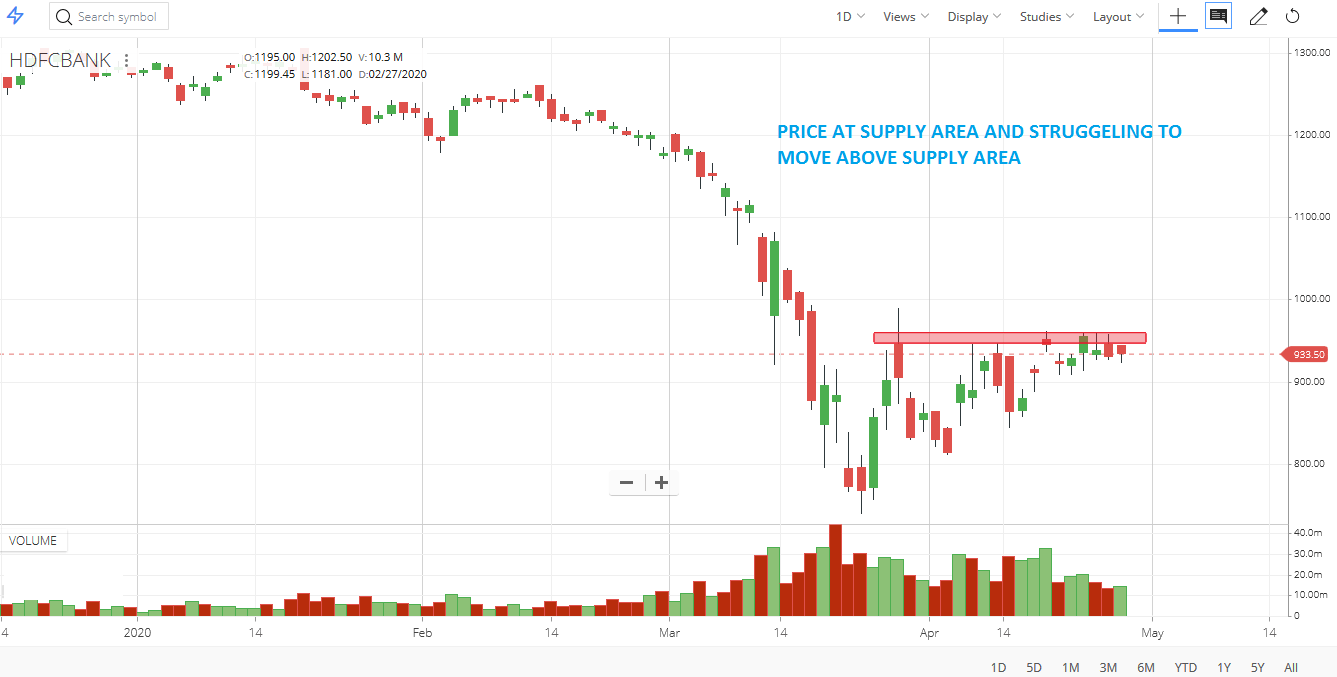
- HTF support and resistance Or SUPPLY AND DEMAND ZONE
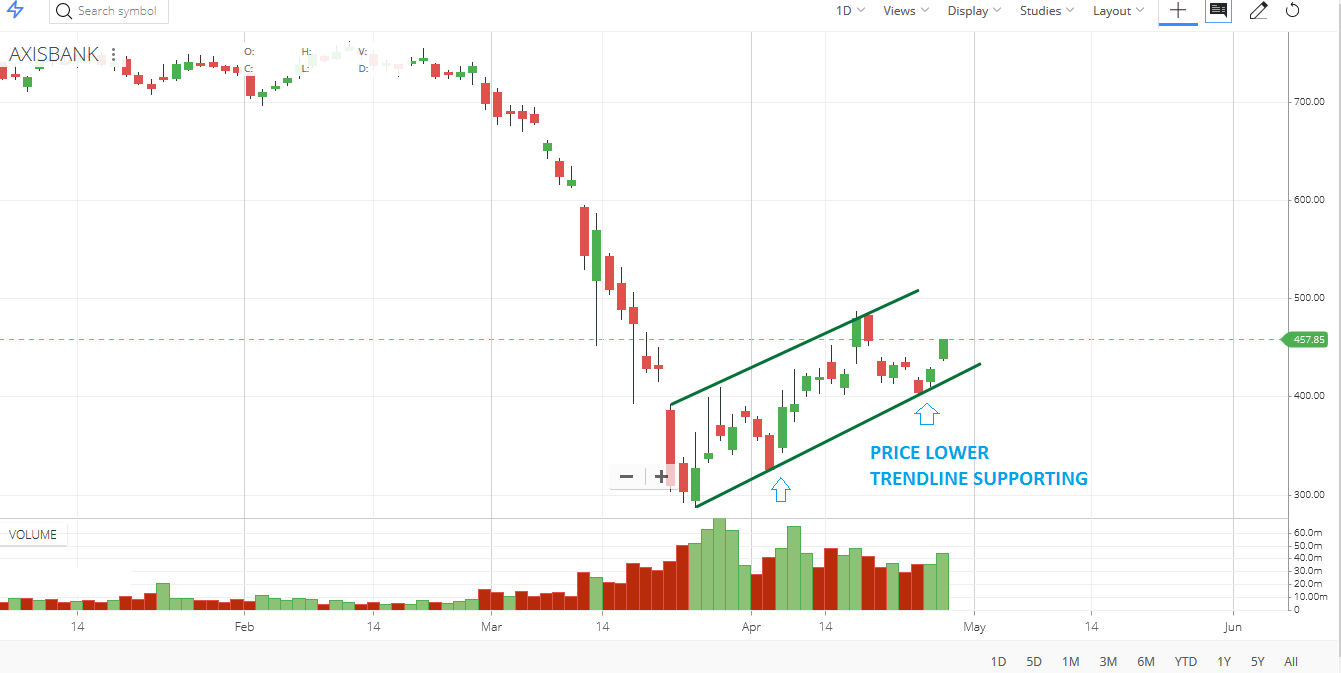
- HTF trend channel(demand and supply line)
- HTF SENTIMENT
- HTF SOS AND HTS SOW
Let’s analyze the chart
We have taken three stock-based on the above three stock selection method


Intermediate Time Frame (ITF) HOURLY
We will define the structural framework within which our trading timeframe (TTF)price action will move in this time frame. In this time frame, we will
- Indemnifying trend and
- Marking the nearest supply and demand zone
Let’s analyze the above three charts in the intermediate time frame above three charts.


Trading Time Frame (TTF) 5 MINUTES
We will use a trading time frame(TTF) FOR
- Used for zone selection
- Used for entry, exit, and stop-loss placement
How to select a zone?
Step 1
Marking the nearest supply and demand zone
Step 2
Find where we are with respect to the zone.
- If the trend is up and we are in the supply zone and avoid a long trend, we become sellers as the price at the supply zone or wait for a clear breakout from the supply zone.
- If the trend is up, we will be in the demand zone and looking for long-term opportunities.
- If we are in the middle of the trend, we can go with the intermediate trend.
Let’s go to the trading time frame
Axis Bank Case Study
Sun Pharma Case Study


HDFC Bank Case Study


Multiple Timeframe Analysis (MTA) is a trading strategy where traders analyze the same asset under different timeframes to spot trends, confirm signals, and time their entries and exits more effectively. This typically involves looking at longer-term charts to identify the general trend or range for intraday trading and then drilling down to shorter timeframes for trade execution. Here’s how you might apply MTA for intraday trading:
Multiple Timeframe Analysis helps intraday traders to align their short-term trading strategy with the longer-term market trend, increasing the probability of success. However, it’s crucial to maintain flexibility, as market conditions can change rapidly. Effective risk management and the discipline to follow a pre-defined trading plan are essential to successful intraday trading using MTA.
In the next article, I will discuss VWAP Trading. In this article, I explain the Multiple Time Frame Analysis for Intraday Trading in detail. I hope you enjoy this article. Please join my Telegram Channel, YouTube Channel, and Facebook Group to learn more and clear your doubts.
Registration Open – Microservices with ASP.NET Core Web API
Session Time: 6:30 AM – 8:00 AM IST
Advance your career with our expert-led, hands-on live training program. Get complete course details, the syllabus, registration, and Zoom credentials for demo sessions via the links below.

One problem with intraday I face is how to short list correct stock out of thousands of available stocks. Do you have a strategy for this?
Thank you