Back to: Trading with Smart Money
How to Trade Bull Flag and Bear Flag Patterns in Trading
In this article, I will discuss How to Trade Bull Flag and Bear Flag Patterns in Trading. Please read our previous article discussing the Top 7 Chart Patterns in Trading Every Trader Needs to Know.
How to Trade Bull Flag and Bear Flag Patterns in Trading?
The bear flag pattern is a popular continuation price pattern used by technical traders within the financial markets to determine trend continuations. In this article, we will discuss bull flag trading opportunities and the topic we will cover:
- Definition of a bear flag pattern
- How does it work?
- How do you identify a bearish flag?
- Element of the flag pattern
- How to Trade Bull Flag Pattern?
- Bear flag vs bull flag.
- Bull flag vs. pennant
What is a Bullish Flag Pattern in Trading?
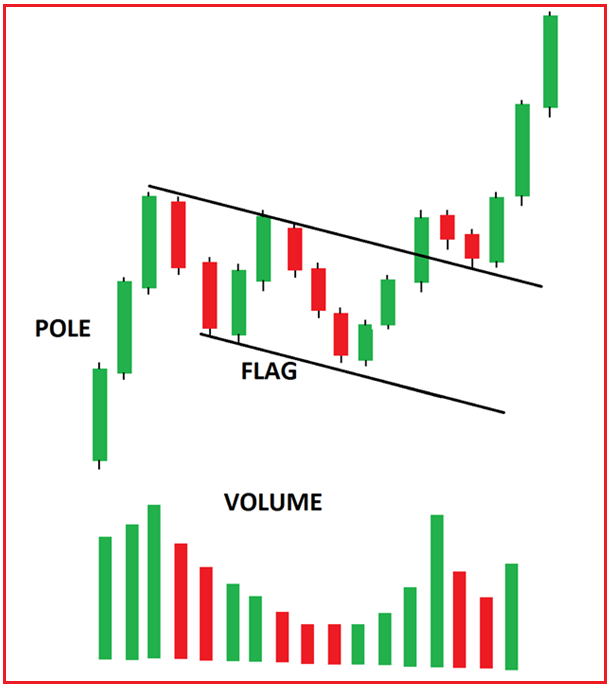
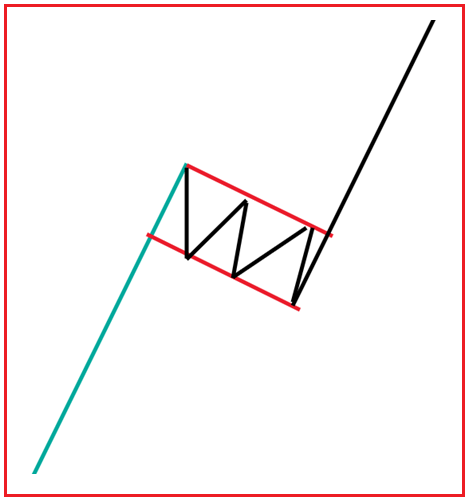
The Bullish Flag Pattern is a trend continuation chart pattern. A bull flag pattern is a chart pattern that occurs when a stock is in a sharp, strong uptrend. It is called a flag pattern because when you see it on a chart, it looks like a flag on a pole, and since we are in an uptrend, it is considered a bullish flag.
Pattern Structure
Defines a Flag pattern using two criteria: pole and flag
- Pole: Look for a sharp, strong, trending move. This means the range of the candles is more bullish than usual, and they tend to close near the highs. usually shown by large body candles. and strong volume in the same direction.
- Flag: weak pullback AFTER strong, sharp move, usually shown by small-bodied candles. The flag is made up of two parallel lines. The pullback should consist of smaller-range candles (compared to the earlier move). The “tighter” the range, the more likely the market will break out higher.
Logic
After the strong move higher, the market becomes overbought, so the market needs to take a “rest.” Here’s where you can expect a potential Bull Flag to form. A small break before the market continues moving in the same direction.
Volume Description
- Steep price advance preceding the formations on heavy volume.
- Dramatic drop-off inactivity as the consolidation patterns form. Volume should decrease as the Flag pattern forms.
- Then, the sudden high-volume activity on the upside breakout
Entry and Stop Loss
Trade the breakout of the flag in the direction of the pole. Stop-loss should be below the flag support in a bull flag breakout entry. Look for confluence factor-like 20ema or any sr line.
Target
Measuring technique: Measure the height of the flag pole. Then, extend it from the lowest point of a bullish flag.
How to Trade Bull Flag Pattern?
- Price is in sharp up move on high relative volume (ACT AS POLE)
- Prices consolidate at or near highs with a defined pullback pattern like flag, pennant, or tight range.
- Buy when prices break out above the consolidation pattern on high volume.
- Place stop orders below the bottom of the consolidation pattern.
- Targets should be at least 2:1 risk/reward
Bull Flag vs Bear Flag in Trading
A bear flag is identical to a bull flag, except the trend will be to the downside. The bull flag and bear flag patterns are both continuation patterns found in the price charts of financial instruments. They are named for their appearance, which resembles a flag on a pole, and for the direction they suggest the price is likely to continue. Here’s a comparison of the two:
Bull Flag:
- Appearance: After a significant upward move, the price consolidates and drifts downwards in a narrow, sloping range that resembles a flag. This “flag” forms after the “flagpole,” which is the initial price surge.
- Market Sentiment: Indicates that buyers are temporarily taking a break before likely continuing to drive the price upward.
- Volume Profile: The volume typically declines during the flag’s formation and increases during the breakout.
- Trade Strategy: Traders look for an entry point when the price breaks above the upper boundary of the flag pattern on increased volume. Stop losses are often placed below the lowest point of the flag.
- Expected Outcome: The pattern suggests that after the brief period of consolidation, the trend will resume, and the price will continue to increase.
- Profit Target: The expected rise in price after the breakout is often estimated to be similar in length to the flagpole.
Bear Flag:
- Appearance: After a significant downward move, the price consolidates and drifts upwards in a narrow, sloping range that resembles an upside-down flag. The “flagpole,” in this case, is the initial price drop.
- Market Sentiment: Indicates that sellers temporarily pause before likely continuing to push the price downward.
- Volume Profile: The volume generally decreases during the flag’s formation and then increases during the breakdown.
- Trade Strategy: Traders look for an entry point when the price breaks below the lower boundary of the flag pattern on increased volume. Stop losses are often placed above the highest point of the flag.
- Expected Outcome: The pattern suggests that after a brief period of consolidation, the trend will resume, and the price will continue to decrease.
- Profit Target: The expected decline in price after the breakdown is often estimated to be similar in length to the flagpole.
Both patterns are typically short-term in nature and are used by traders to capitalize on a continuation of the current trend. The primary difference lies in the direction of the expected continuation: bull flags anticipate an upward move, while bear flags anticipate a downward move.
In both cases, the flag portion of the pattern represents a period of consolidation, which can be seen as the market ‘catching its breath’ before continuing its prior strong trend. These patterns can be found across different time frames (like minutes, hours, and days) and are applicable in various markets, including stocks, forex, commodities, and cryptocurrencies. It is important for traders to wait for the price to break the consolidation pattern before entering a trade to avoid false signals.
How to Trade Bull Flag and Bear Flag Patterns
Trading bull flag and bear flag patterns are common strategies for traders looking to capitalize on the market’s momentum. These patterns are considered continuation patterns, meaning a continuation of the prior trend typically follows them. Here’s how to identify and trade these patterns:
Bull Flag Pattern in Trading:
- Identification: A sharp rise in the price (the “flagpole”). A downward-sloping consolidation forms the “flag,” which should be less steep than the flagpole. Typically occurs during an uptrend.
- Entry Point: Wait for the price to break above the upper trendline of the flag pattern. The breakout should be on higher volume, which confirms the pattern.
- Stop Loss: A stop loss can be placed just below the lowest point of the flag or the breakout point.
- Profit Target: The profit target is often set at a distance equal to the height of the flagpole, projected above the breakout point.
Bear Flag Pattern in Trading:
- Identification: A sharp decline in the price (the “flagpole”). An upward-sloping consolidation that forms the “flag,” which should be less steep than the flagpole. Typically, it occurs during a downtrend.
- Entry Point: Wait for the price to break below the lower trendline of the flag pattern. The breakdown should be higher to confirm the pattern’s validity.
- Stop Loss: A stop loss can be placed just above the highest point of the flag or the breakdown point.
- Profit Target: The profit target is often set at a distance equal to the height of the flagpole, projected downward from the breakdown point.
Trading Tips:
- Confirmation: Always wait for the breakout or breakdown before entering the trade. Premature entering can result in trading a false pattern.
- Volume: Look for an increase in volume on the breakout/breakdown as it suggests a stronger signal.
- Retest: Sometimes, after the breakout/breakdown, the price may retest the trendline of the flag pattern. This can provide a second chance to enter the trade.
- Time Frame: Flag patterns can be traded on various time frames, but typically, the longer the time frame, the stronger the signal.
- Consolidation Duration: The consolidation should not be too prolonged. Ideally, it lasts from a few days to a few weeks for daily charts.
- Trend Strength: The flagpole should clearly indicate strong momentum and trend strength.
- Risk-Reward Ratio: Always consider the risk-reward ratio of the trade. It is commonly recommended to look for a minimum of 2:1 reward to risk.
- Market Context: Consider the overall market conditions and whether they support continuing the trend.
- Technical Indicators: Some traders also use other technical indicators, like moving averages or the relative strength index (RSI), for additional confirmation.
As with any trading strategy, it’s important to practice good risk management and not risk more than a small percentage of your trading capital on any single trade. Moreover, backtesting your strategy on historical data can provide a better understanding of its potential effectiveness before applying it to live markets.
In the next article, I will discuss How to Become a Successful Trader. In this article, I explain How to Trade Bull and Bear Flag Patterns in Trading. I hope you enjoy this Bull Flag and Bear Flag pattern in the Trading article. Please join my Telegram Channel, YouTube Channel, and Facebook Group to learn more and clear your doubts.
About the Author: Pranaya Rout
Pranaya Rout has published more than 3,000 articles in his 11-year career. Pranaya Rout has very good experience with Microsoft Technologies, Including C#, VB, ASP.NET MVC, ASP.NET Web API, EF, EF Core, ADO.NET, LINQ, SQL Server, MYSQL, Oracle, ASP.NET Core, Cloud Computing, Microservices, Design Patterns and still learning new technologies.