Back to: Trading with Smart Money
Candlestick Pattern Analysis
In this article, I will cover all Reversal Candlestick Pattern Analyses in detail. Candlestick Pattern Analysis is a method used in the analysis of financial markets. It involves using candlestick charts to identify patterns that can suggest future price movements. Candlestick charts display a security’s high, low, opening, and closing prices for a specific period. Here are some key aspects of Trading Candlestick Pattern Analysis:
- Candlestick Components: Each candlestick typically represents one day of trading data (though it can represent different periods). A candlestick has a wide part, known as the “real body,” representing the range between the opening and closing prices. The lines extending above and below the body, known as “shadows” or “wicks,” represent the high and low prices.
- Bullish and Bearish Candlesticks: If the closing price is higher than the opening price, the candlestick is often colored white or green and is considered bullish. Conversely, if the closing price is lower than the opening price, the candlestick is colored black or red and is considered bearish.
- Pattern Recognition: Traders use various candlestick patterns to predict future market movements. Common patterns include the “Doji,” “Hammer,” “Engulfing,” “Shooting Star,” and “Hanging Man.” Each pattern has a unique structure and significance.
- Market Sentiment: Candlestick patterns are used to gauge market sentiment. For example, a series of bullish candlesticks may indicate a strong buyer’s market, while bearish candlesticks suggest a seller’s market.
- Combination with Other Analysis: While candlestick patterns can provide valuable insights, they are often used in combination with other forms of technical analysis, like trend lines and moving averages, to validate trading decisions.
- Limitations: Like all trading tools, candlestick pattern analysis is not foolproof and should be used cautiously. False signals can occur, and external factors, such as news events, can override pattern predictions.
Outside Reversal Pattern
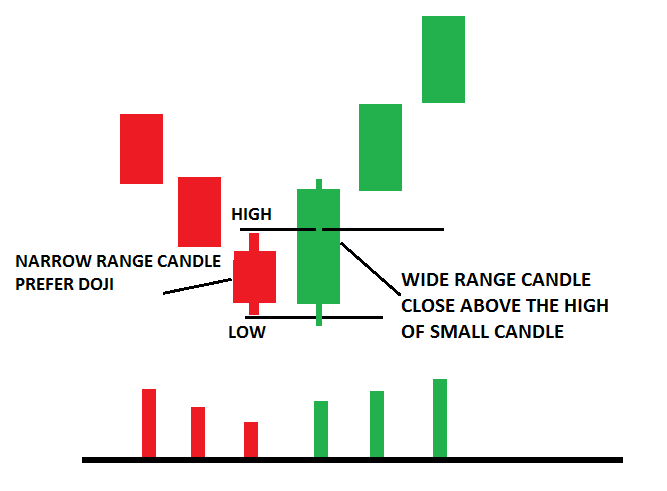
BULLISH OUTSIDE REVERSAL PATTERN STRUCTURE
- The first candle is a narrow-range candle or Doji
- The second candle completely engulfs the first candle and closes above the first candle high.
- The second candle is low below the first candle’s low, but the close must be above the first candle’s close and high above the previous candle’s high
- A high-volume should accompany the second candle


OUTSIDE REVERSAL PATTERN PSYCHOLOGY
What exactly is going on at these levels? Let us understand the two-candlestick pattern psychology. The first candle should be narrow or doji.
A Doji represents either one of two things:
- Buyers and sellers are equally strong
- Indecision in the market if it appears after an extended move
Basically, smart money testing the selling pressure below support ensures no new business is needed at these levels. When there is no selling pressure below the low of the previous candle, smart money starts to drive the price up

How do Reversal candlestick Patterns work?
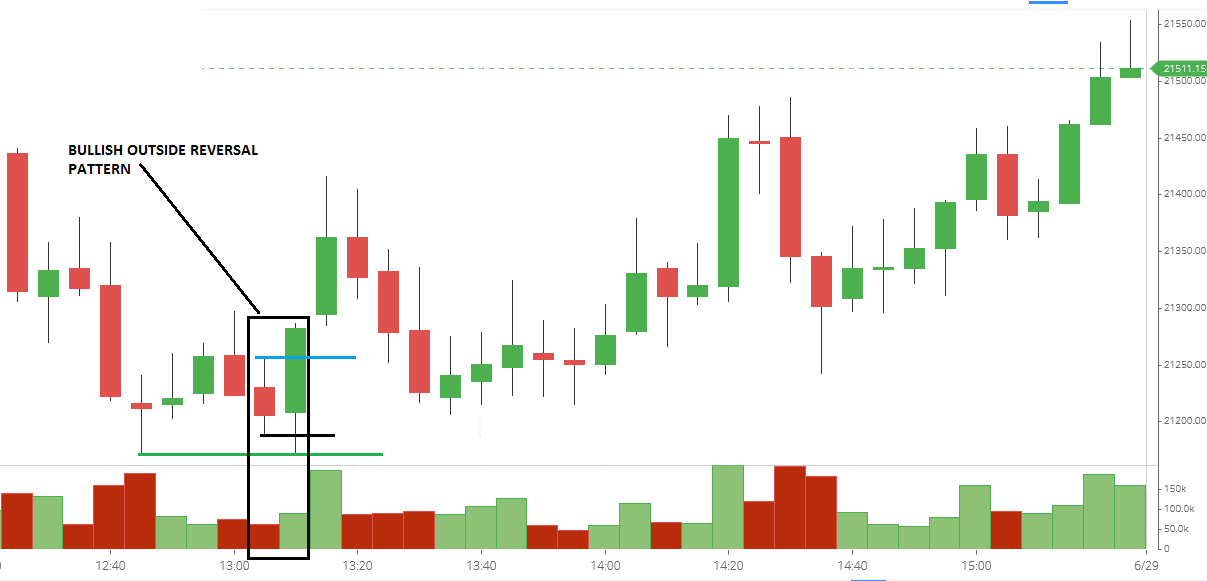
Reversal candlestick psychology is one of the reasons why reversal patterns are such effective predictors of price reversals. Here’s an example:


LOW OF BULLISH OUTSIDE REVERSAL PATTERN As support

BULLISH OUTSIDE REVERSAL PATTERN should be followed by bullish price action. One more bull candle should be formed to confirm the bullish reversal or validate the bullish engulfing candle.

They will work best in trending conditions. Trade with the trend. In an uptrend, bullish outside reversal patterns work better.

Trade from support or resistance level

How do we trade it?
- Buy above the bullish Engulfing pattern.
- Stop loss below the pattern.

Candlestick Pattern Analysis
Candlestick pattern analysis is a technique used in technical analysis of financial markets, particularly in the trading of stocks, commodities, and currencies. It involves the interpretation of specific patterns formed by the “candles” on a candlestick chart. Each candle represents price movements within a specified time period and is depicted by a body and wicks (or shadows). Here are some key aspects of candlestick pattern analysis:
Candlestick Components:
- Body: Shows the opening and closing prices.
- Wicks/Shadows: Represent the high and low prices during the candle’s time period.
Single Candle Patterns: These include:
- Doji: Indicates indecision, where opening and closing prices are nearly equal.
- Hammer: A bullish reversal pattern formed after a price decline.
- Shooting Star: A bearish reversal pattern that occurs after an uptrend.
Multi-Candle Patterns: These involve the combination of multiple candles to form patterns, such as:
- Bullish Engulfing: A small bearish candle followed by a larger bullish candle.
- Bearish Engulfing: A small bullish candle followed by a larger bearish candle.
- Morning Star: A bullish reversal pattern involving three candles.
Trend Analysis: Candlestick patterns are often used to gauge a trend’s strength or predict a reversal.
Volume and Context: When interpreting these patterns, it’s important to consider the trading volume and the broader market context.
Limitations: While candlestick patterns can provide valuable insights, they are not foolproof and should be used in conjunction with other technical analysis tools.
Psychology: Candlestick patterns reflect the psychology of market participants and can indicate shifts in sentiment.
By analyzing these patterns, traders attempt to predict future price movements. However, it’s essential to remember that candlestick analysis, like all forms of technical analysis, is not a guarantee of future price movements and should be used as part of a broader trading strategy.
Stay tuned. I will add the remaining reversal pattern to this article. In the next article, I will discuss Finding Entry Opportunities using Volume Spread Analysis in Trading. In this article, I try to explain the reversal candlestick pattern analysis in detail. I hope you enjoy this article. Please join my Telegram Channel, YouTube Channel, and Facebook Group to learn more and clear your doubts.

what does average lower wick represent ??? (a) rejection from the level (b) warning that market is showing that it can move till that level and we should wait for the call trade