Back to: Trading with Smart Money
Price Action Trading: How To Read Charts Like A Pro
Introduction to price action trading

Price action trading is one of the most effective and time-tested trading strategies used by professional traders worldwide. It allows you to read market sentiment, predict future price movements, and spot high-probability trade setups—all without relying on lagging indicators. In this complete guide, you’ll learn:
- How to interpret price charts like a professional trader.
- Key price action concepts for profitable trading.
- Proven trading strategies using pure price action.
Table of Contents
- Introduction
- What is Price Action Trading?
- Why Price Action Trading Works
- Core Concepts of Price Action Analysis
- Market Structure
- Support and Resistance
- Swing Highs and Lows
- Momentum and Trend Strength
- How to Read Price Charts Like a Pro
- Identifying Market Phases
- Spotting Reversal and Continuation Patterns
- Using Price Action for Entry and Exit Points
- Essential Price Action Trading Strategies
- Common Mistakes to Avoid in Price Action Trading
- Pro Tips for Successful Price Action Trading
- Conclusion
- FAQs
What is Price Action Trading?
Let’s start by understanding what Price Action is. Price Action refers to analyzing the movement of price over time without relying heavily on indicators. It focuses on:
Price action trading is all about understanding the naked charts, that means no indicators, no complicated tools. Instead, we focus on market structure, strength of price movements, support & resistance levels, and the formation of candlesticks at key levels. Think of price action as reading full sentences in the market rather than just individual words. It helps you see the bigger picture and truly understand the market’s narrative. Unlike indicator-based trading, price action focuses on raw price data, allowing traders to make clean and objective decisions.

Price action gives you the big picture—it shows where the market is heading and why. It’s like having a map before you start a journey. Traders analyse trends, support and resistance levels, swing highs and lows, and market structure to predict future price direction.
Price Action = Trading with Clarity
Naked price chart vs indicator-heavy chart

Key Benefits of Price Action Trading:
- Minimal lag: No reliance on indicators.
- Versatile: Works on all timeframes and markets.
- Clear market story: Understand who controls the market—buyers or sellers.
Pro Tip: Mastering price action means you can trade any market—forex, stocks, crypto, or commodities—with confidence.
Why Price Action Trading Works?
Why does price action work so well? Because price is king. Indicators are just derived from price. By reading price charts, you’re directly understanding what buyers and sellers are doing in real-time.
🚀1. It Reflects Market Psychology
- Every price movement reflects the collective actions of traders.
- Candlestick patterns, trend formations, and price levels reveal trader sentiment.
📈2. It Shows Real-Time Supply and Demand
- Support zones = Areas where buying pressure emerges.
- Resistance zones = Areas where selling pressure dominates.
🏹3. It Helps You Stay Ahead of the Market
- Indicators lag, but price action provides real-time market data, helping you anticipate moves before they happen.

It’s also used by institutional traders, so when you master price action, you’re essentially reading the footprints of the smart money. Price action tells the story of the market, giving traders the context needed for strategic decision-making.
How to Read Price Action – The 4-Step Framework
Let’s start by understanding what Price Action is. Price Action refers to analyzing the movement of price over time without relying heavily on indicators. It focuses on:
- Step 1: Identify Market Structure
- Step 2: Analyze Support/Resistance
- Step 3: Candlestick Behaviour at key level
- Step 4: Confirm with Momentum
By following these steps, you’ll stop guessing trades and start executing high-probability setups.
Step 1: Identify Market Structure
The foundation of price action trading understands market structure.
- First, determine if the market is trending or ranging. (stages of the chart)
Markets move in phases/stages:
- Accumulation: Buyers stepping in (potential bullish reversal). Range-bound: Sideways movement between support and resistance
- Markup/uptrend: Strong uptrend phase. Higher highs (HH) and higher lows (HL).
- Distribution: Sellers stepping in (potential bearish reversal). Range-bound: Sideways movement between support and resistance
- Markdown/doentrend: Strong downtrend phase. Lower highs (LH) and lower lows (LL).


Recognize these phases for timely entries and exits.
Pro Tip: “Trade with the trend in trending markets and reversals at extremes in ranges.”
Step 2: Analyse Support and Resistance
Support and resistance are the most powerful price levels in trading. Support and resistance levels are where the market often reacts. Watch how the price behaves here. Spot Reversal and Continuation Patterns at this key support and resistance level
Support: Price levels where demand overcomes supply, causing prices to rise.
Resistance: Price levels where supply exceeds demand, causing prices to fall

How to Identify Strong Levels:
🔹Historical Price Reactions: Look for areas where the price reverses.
🔹Round Numbers: Levels like 100, 1500, 2000 act as psychological support/resistance.
🔹Trendline/MA Confluence: Support/resistance levels aligning with trendlines are stronger.
Key Rule: Only take trades when candlestick patterns align with support/resistance levels.
How to Use Them:
- Buy at support during uptrends.
- Sell at resistance during downtrends.
- Watch for breakouts for trend continuation.
Example: Bullish engulfing at key support = high-probability long trade.
Risk Tip: Patterns at key levels carry more weight—ignore patterns in the middle of ranges.


Step 3: Read Candlestick Behaviour in Context
- Now, analyze how candlesticks behave at key levels. Are they showing rejection, like a pin bar, or continuation, like bullish engulfing patterns?
- Context is everything. A bullish pin bar at support? That’s a high-probability long setup.


Step 4: Confirm with Price Momentum
Observe how prices are moving now compared to the previous move. Watch the strength of moves—strong, fast moves often continue; weak, slow moves may reverse. Use momentum analysis to spot potential reversals or breakouts.
Pro Tip: Combine momentum analysis with price action for better timing. When momentum slows at key levels, watch out for a potential reversal.

The strength of the price movement decreases from left to right. Harmony occurs when price and volume move together. Divergence happens when price moves up, but volume drops—this shows weakness.
Weak Momentum
- Weak momentum: Choppy price action with volume decreases and shallow trends. Prepare for reversals

Weak bearish momentum when approaching support. Not expecting downside breakout and highly probably expect bullish reversal from support


Strong Momentum:
Strong momentum: Sharp price moves volume and minimal pullbacks.


Essential Price Action Trading Strategies
Let’s explore some classic price action patterns every trader must know. Step by step
- Identify Market Structure
- Spot Key S&R Levels
- Interpret Candlestick Context
- Confirm with Momentum Shifts
Breakout Trading Strategy
- Identify key levels where price consistently reverses.
- Entry: Enter after a wide spread bullish bar with high volume closes above resistance.
- Stop-loss: Below the breakout candle.
- Take-profit: Ride the trend with a trailing stop.

Breakout and Retest
- After price breaks a key level, it often comes back to retest it before continuing.”
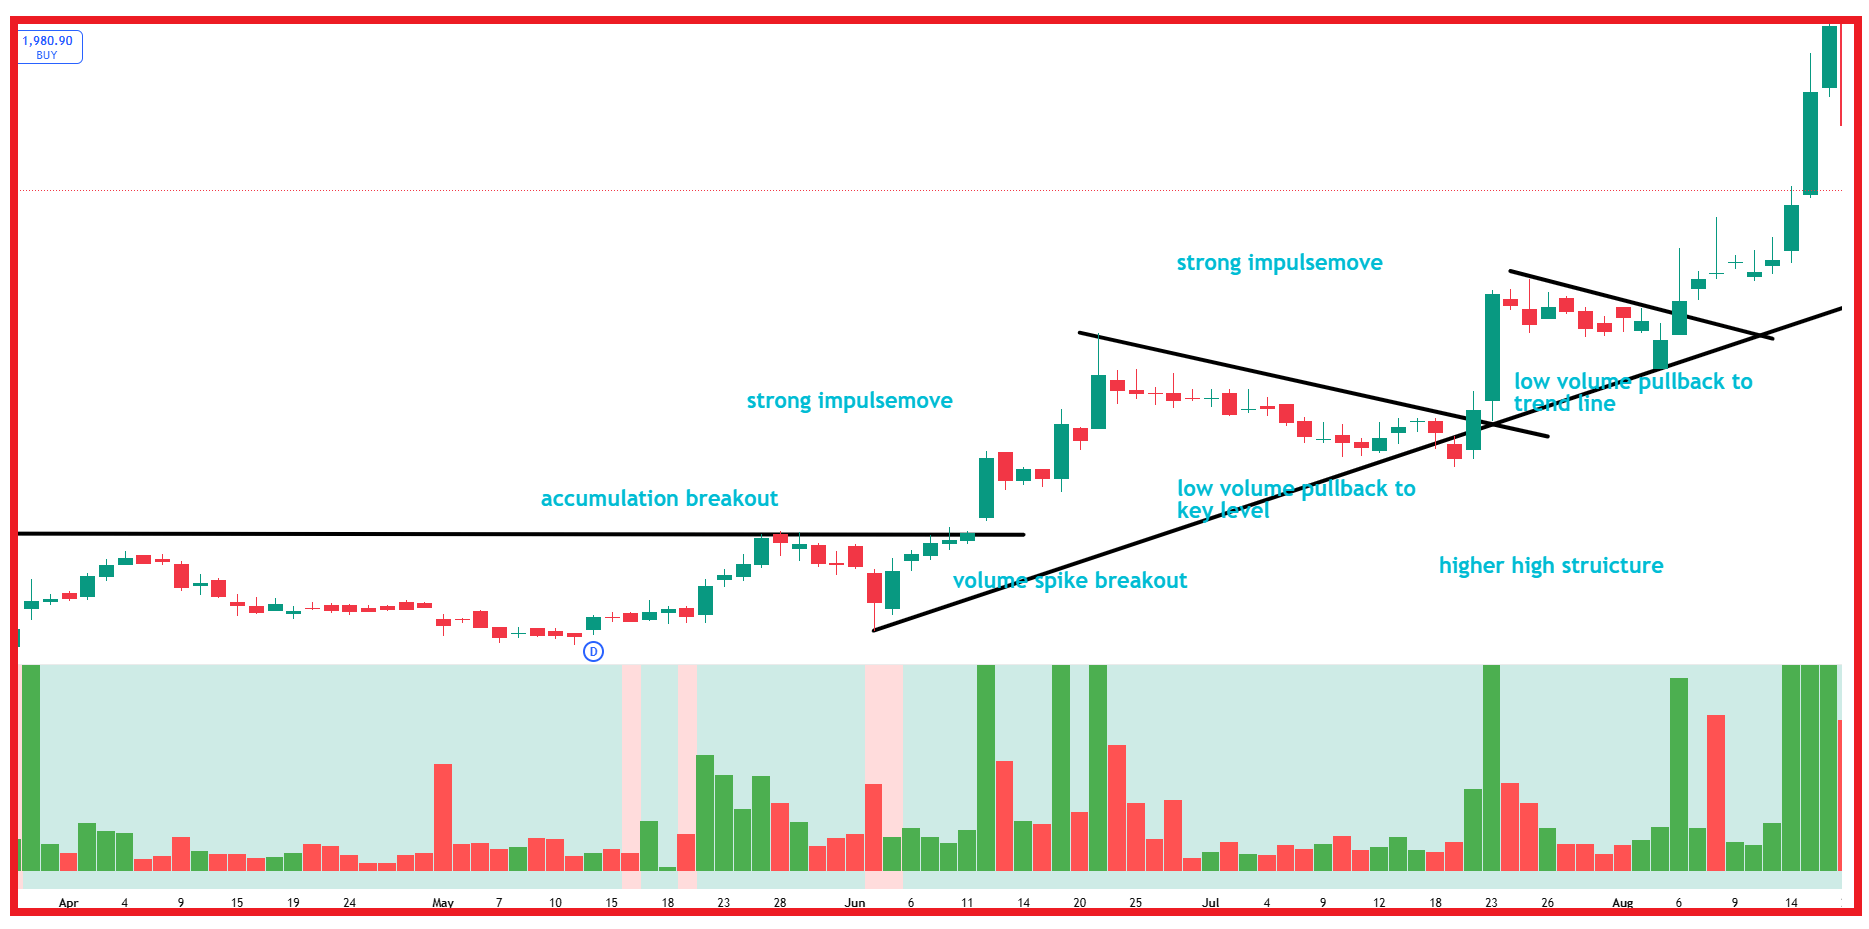
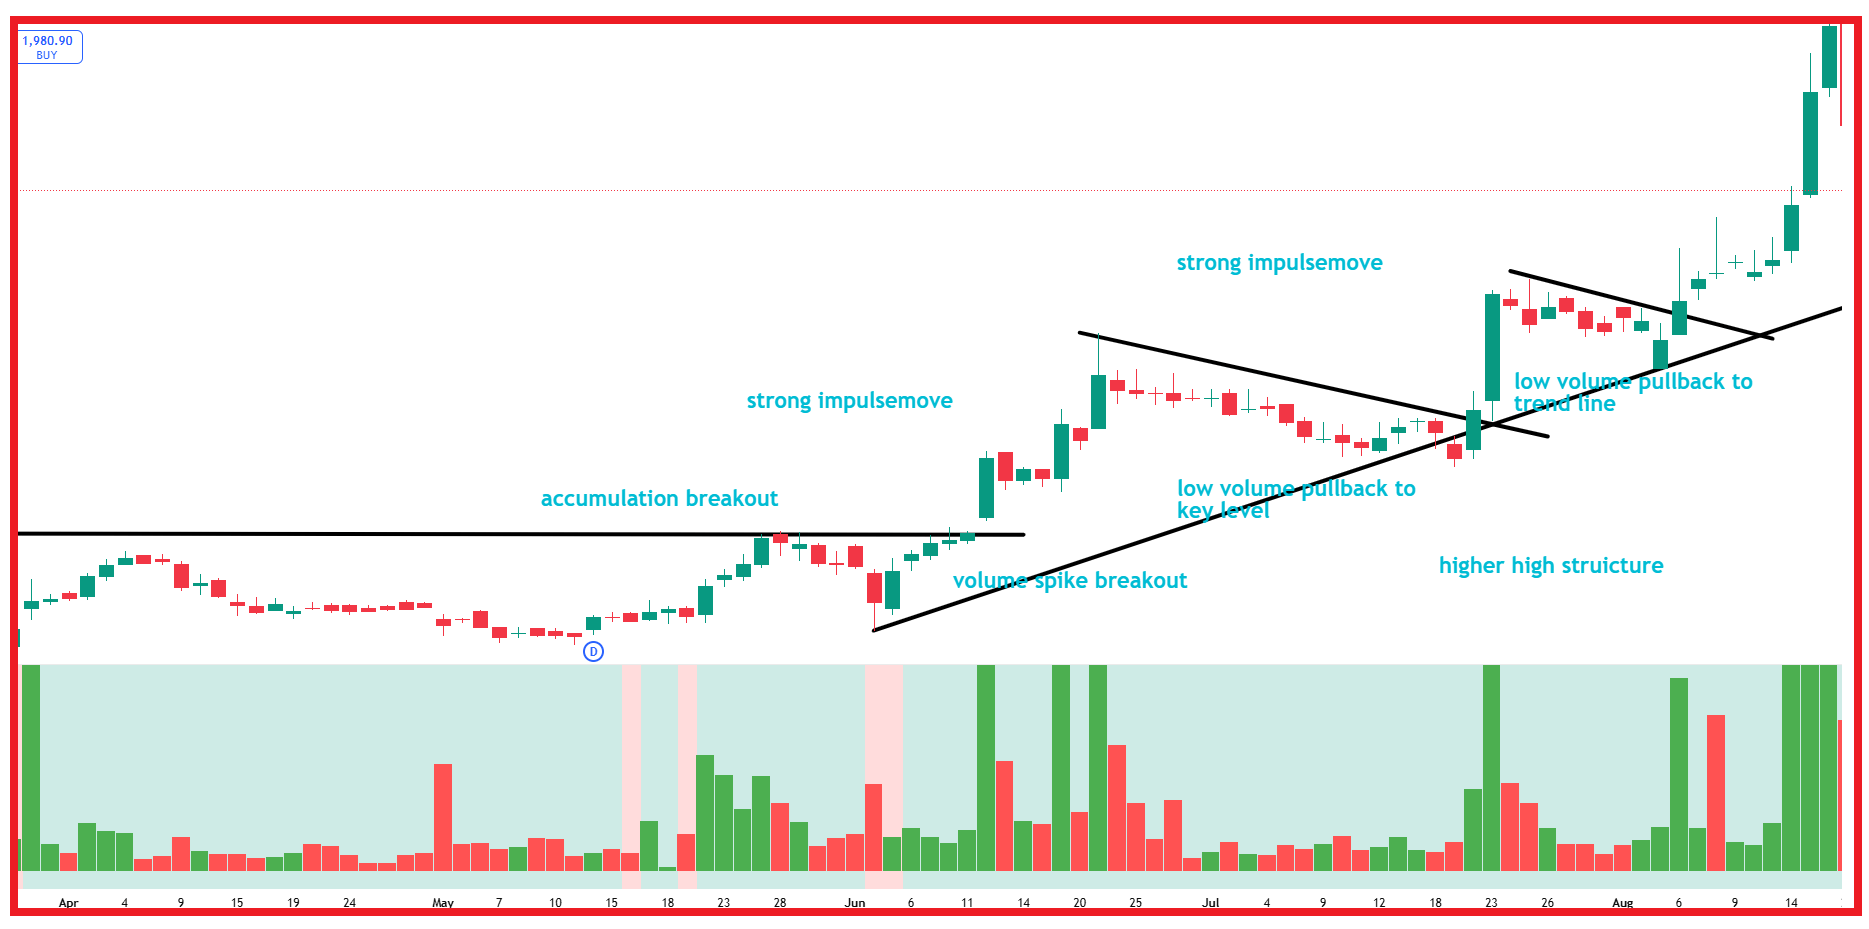
- Breakout of resistance and retest as new support. The retest volume and volatility should decrease.
- This retest gives you a low-risk, high-reward trade entry.

Fakeouts (False Breakouts)
- Sometimes, price breaks a level but quickly reverses. This is a fakeout designed to trap retail traders.
- Pro Tip: Wait for confirmation after a breakout before entering trades.

Reversal Trading Strategy
Setup: “Wait for price to reach a major support or key level. Then look for any bullish reversal candle for long entries
Volume and volatility: decreasing when approaching support.
Entry: On forming a bullish engulfing or hammer after the pullback to a key level.
Risk Tip: “Place your stop-loss below the support or above the resistance for added protection.”


Trend Continuation Patterns
- Patterns like flags and pennants show that the trend is pausing, not reversing.
- Once price breaks out of these patterns, the trend usually resumes.

Pullback Strategy
- Setup: Identify an uptrend with higher highs and lows. When price pulls back to the key level of support, look for any bullish reversal candle for long entries.
- Volume: Decreasing during pullbacks, increasing during rallies.
- Entry: On forming a bullish engulfing or hammer after the pullback to a key level.
- Stop-loss: Below/above the rejection candle.
Using price action, identify a strong trend. On pullbacks, watch for a bullish reversal pattern from a key level to re-enter the trend.

Pro Tips for Mastering Price Action
Before we wrap up, here are a few pro tips that will fast-track your success in price action trading.
✅ Trade with the trend—don’t fight it!
✅ Patience is key. Wait for price action confirmation.
✅ Always look at the bigger picture—zoom out before you zoom in.
✅ Combine price action with volume for more accuracy.
Common Mistakes to Avoid in Price Action Trading
❌Ignoring market context and trading patterns in isolation.
❌ Entering trades too early without confirmation.
❌ Neglecting risk management and trading without stop-losses.
❌ Overtrading minor movements without clear setups.
Patience is the key—wait for confluence before pulling the trigger.
❓FAQs
🔹What is price action trading?
Price action trading is a strategy that uses past price movements to forecast future price behavior without relying on technical indicators.
🔹Is price action trading suitable for beginners?
Yes! It’s one of the best trading strategies for beginners because it focuses on understanding the market’s story through price movements.
🔹What timeframes work best for price action trading?
- Scalping: 1M, 5M charts
- Day Trading: 15M, 1H charts
- Swing Trading: 4H, Daily charts
🔹How can I improve my price action trading skills?
- Practice on demo accounts.
- Backtest historical charts.
- Learn from expert resources and courses.
To learn more in-depth about Price Action Trading: How To Read Charts Like A Pro, please check the following video on our YouTube channel.
In this article, I explain Price Action Trading: How to Read Charts Like A Pro. I hope you enjoy this article and better understand Price Action Trading: How To Read Charts Like A Pro. Please join my Telegram Channel, YouTube Channel, and Facebook Group to learn more and clear your doubts.
