Back to: Trading with Smart Money
Mastering Candlestick Patterns: The Complete Guide for Beginners
Hey traders! Are you struggling to understand candlestick charts? You’re not alone! Today, I’m going to break down everything you need to know about candlestick patterns, how they reflect market psychology, and how you can use them to predict price movements like a pro. Stick around, because by the end of this video, you’ll have a solid foundation in candlestick analysis.” This could be a game changer for your trading journey!
Candlestick patterns are a trader’s best friend when it comes to reading price charts. Whether you are a complete beginner or an experienced trader, understanding how to interpret candlestick patterns is crucial for predicting market movements and making informed decisions.
 ’
’
In this complete guide, we’ll cover:
- Introduction
- What Are Candlestick Patterns?
- Understanding Candlestick Anatomy
- Bullish vs. Bearish Candlesticks
- Top Candlestick Patterns for Beginners
- Doji
- Hammer
- Shooting Star
- Engulfing Patterns
- How to Use Candlestick Patterns in Trading
- Common Mistakes to Avoid
- Pro Tips for Mastering Candlestick Trading
- Conclusion
- FAQs
✨By the end of this guide, you’ll be equipped with the knowledge to read price charts like a pro.
What is a Candlestick?
“First things first — What is a candlestick?
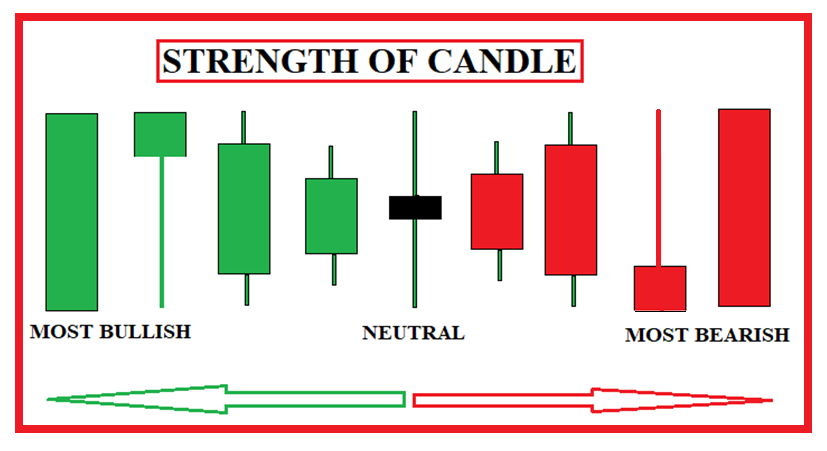
- Candlesticks are a reflection of what buyers and sellers are doing. CANDLES TELL YOU who is in control in that specific time frame.
- Candlesticks tell us immediate information about the supply-demand relationship.
- Multiple candles form patterns that tell us a story.
- Understanding candlesticks is paramount to successfully day trading.
Why Candlestick Patterns Matter:
- Provide real-time market sentiment
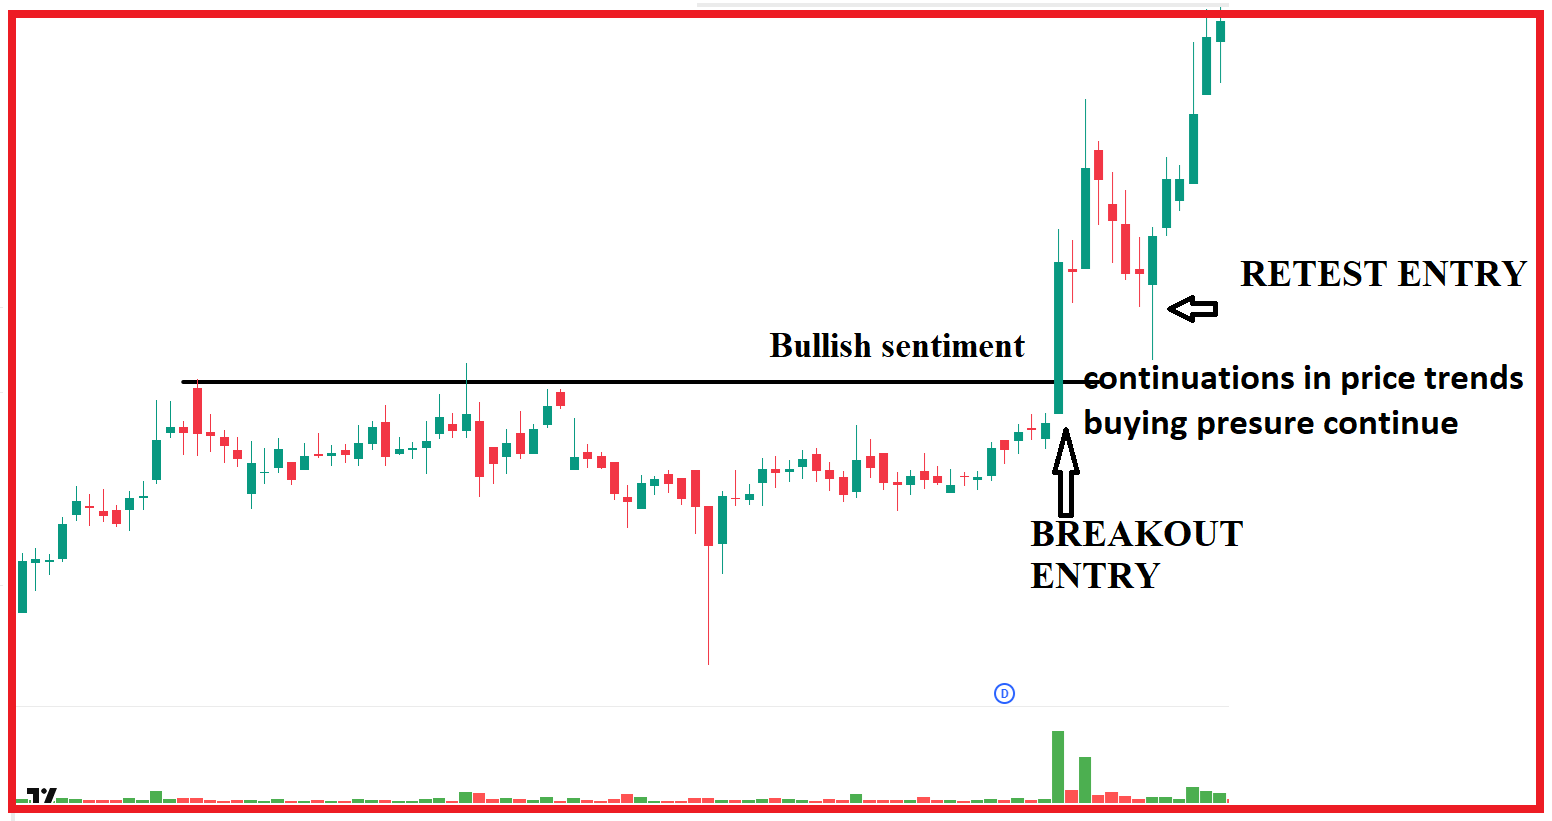
- Identify reversals and continuations in price trends
- Help traders determine entry and exit points

Each candlestick represents six key pieces of information: the Open, High, Low, Close, the Body, and the Range.
- The Open: Where the trading period started.
- The High: The highest price during the period.
- The Low: The lowest price during the period.
- The Close: Where the trading period ended.
- The Body: The area between the open and close — green for bullish and red for bearish.
- The Range: The spread between the high and low.

Understanding Bullish & Bearish Candles
Now let’s talk about bullish and bearish candlesticks.
- Bullish Candlestick: Closes higher than it opens — buyers are in control.
- Bearish Candlestick: Closes lower than it opens — sellers dominate the market.

But here’s a pro tip: A candle alone doesn’t tell the full story. You need volume analysis and context to see if the buyers or sellers have strong backing.
📗Bullish Candlestick with Background Information


- Shows buying pressure; the close price is higher than the open.
- Indicates potential uptrend continuation or reversal at support zones.
- Example Patterns: Hammer, Bullish Engulfing, Morning Star.

📕Bearish Candlestick with Background Information


- Shows selling pressure; the close price is lower than the open.
- Signals potential downtrend continuation or reversal at resistance levels.
- Example Patterns: Shooting Star, Bearish Engulfing, Evening Star.
✨Pro Tip: Look for candlesticks forming at key levels for high-probability setups, either breakout or reversal

Popular Candlestick Patterns and How to Use Candlestick Patterns in Real Trading
1. The Hammer
Structure: Small body (colour doesn’t matter), long lower wick double the body, little or no upper wick. The candle range should be wider.
Meaning: A small body with a long lower wick showing rejection of lower prices or rejection of a price level. The hammer pattern reflects a shift in momentum from sellers to buyers, signaling a potential bullish reversal at the end of a downtrend or during a pullback in an uptrend or at a demand zone. Pin bars with long wicks at key levels indicate price manipulation. The long wick shows smart money testing liquidity before pushing the price the other way.
- ✅Rejection of Price Levels → Smart money stepping in.
- ✅Trend Reversal Signal → Strong rejection leads to the market turning.
- ✅False Breakout Warning → Price trapped traders before reversing.
Volume Tip: Higher volume boosts reliability.
Trading Strategy:
-
- Entry: Above the hammer’s high.
- Stop-loss: Below the hammer’s low.
Confirmation: high volume, at key level, or follow-through candle
🎤 A pin bar tells you that the market tried to move in one direction but failed, leaving a footprint of rejection—a powerful clue for reversal trades.


Trading Strategy: Using Hammer Candle
Step-by-step:
- Identify the pattern (red hammer/green hammer)
- Check the context (trend, support/resistance). Best work at key level (support/demand zone/trend line/ moving average) in confirmed uptrend
- Confirm with volume
- Plan trade entry (above the hammer)
- stop loss (Below the hammer’s wick)


2. The Engulfing Pattern:
Structure: 2nd candle closes above first candle high (bullish engulfing|). Wide reversal candle pattern
Meaning: Buyers overwhelm sellers; a large green candle engulfs the previous red candle. It shows institutional buying. It signals a shift from bearish to bullish sentiment, indicating a potential reversal of pullback or from supply demand zone or key level.
Volume Confirmation: High volume on the engulfing candle confirms strong buyer interest. The second candle should be accompanied by high volume, or volume expansion should be visible in any candle. Sudden volume spike confirms the buyer’s interest from a lower level
Trading Strategy:
-
- Entry: Above the engulfing candle’s high.
- Stop-loss: Below the engulfing candles low.
Confirmation: FOLLOWTHROUGH CANDLE
Trading Tip:
🌟Powerful when appearing at key levels with volume confirmation
💡Pro Tip: If volume is lower, avoid the trade—smart money isn’t involved!


Trading Strategy: The Engulfing Pattern
Step-by-step:
- Identify the pattern (red hammer/green hammer)
- Check the context (trend, support/resistance). Best work at key level (support/demand zone/trend line/ moving average) in confirmed uptrend
- Confirm with volume
- Plan trade entry (above the hammer)
- stop loss (Below the hammer’s wick)


3. Candlestick Reversal Pattern
Bearish 3-Candlestick Reversal Pattern
The pattern consists of three candlesticks, which suggest a shift from bullish to bearish sentiment in the market.
- Meaning: Three-candle pattern showing trend reversal from bearish to bullish. Rejection of higher prices → Sellers gaining control. After a strong uptrend, this represents buyer exhaustion. Smart money begins to sell into the rally, preparing for a trend reversal.”
- Structure:
- green candle (uptrend) indicating the strength of the buyers,
- Small-bodied candle (indecision). Doji, inside candle, or narrow range candle
- Long red candle (bullish confirmation). Indicate momentum shift
Confirmation
- Bias changed with the momentum increase
- Volume confirmation. A spike in volume on the third bullish candle can support the validity of the reversal. Or volume increase


How to Trade the Bearish 3 Candlestick Reversal Pattern?
Step-by-step:
- Identify the pattern
- Check the context (trend, support/resistance). Best work at key level (support/demand zone/trend line/ moving average) in confirmed uptrend
- Confirm with volume
- Plan trade entry
- stop loss

How Volume Confirms Candlestick Patterns?
Volume tells you who is really in control.

- If the volume is high with a narrow candle, smart money might be selling into retail buying — a reversal could be near or observing supply at resistance.
Volume is a crucial factor in confirming candlestick reversal patterns. Here’s how you can use volume to your advantage:
📈Key Volume Insights:
🔍Volume Spikes at Key Levels:
- A high-volume spike during a reversal candlestick pattern indicates strong market participation, making the reversal more reliable.
- High volume breakout: Confirms strong price moves and trend strength.
- Volume spikes at end: Often indicates smart money activity—watch for reversals.
🧠Volume Divergence:
- If the price is moving in one direction, but volume is declining, it could be a sign of weak momentum and potential reversal.
- Low volume: Suggests weak moves or false breakouts.
- Low volume reversal from support vs high volume reversal from support


Host Tip: Always validate candlestick patterns with volume. It’s the other half of the trading story.
Pro Tips and Common Mistakes
Here are some pro tips and common mistakes traders make with candlesticks:
Common Mistakes
❌ Trading patterns without context (key levels, trends).
❌Ignoring volume confirmation.
❌ Overtrading minor patterns that lack strong signals.
❌Entering trades too early without confirmation candles.
✨Patience is key. The best candlestick patterns form at high-probability zones.
🌟Pro Tips for Mastering Candlestick Trading
⚡Tip 1: Combine candlestick patterns with support and resistance, supply and demand zones, trendlines, and moving averages.
⚡Tip 2: Wait for candle close confirmations—don’t trade mid-candle.
⚡Tip 3: Backtest patterns on historical charts.
⚡Tip 4: Use multi-timeframe analysis for higher accuracy.
⚡Tip 5: Track your performance in a trading journal.
FAQs
🔹What is the most reliable candlestick pattern?
The Engulfing pattern is considered highly reliable, especially when combined with volume confirmation and forming at key levels.
🔹Can candlestick patterns predict market trends?
Yes! Candlestick patterns, especially reversal patterns like Hammer and Shooting Star, can predict trend changes when paired with volume and price action context.
🔹Are candlestick patterns effective for forex trading?
Absolutely. Candlestick analysis is widely used in forex trading for identifying reversals, breakouts, and trend continuations.
🎯Conclusion
Candlestick patterns provide deep insights into market psychology. By understanding key patterns like the Hammer, Doji, Shooting Star, and Engulfing patterns, you’ll be able to:
✅ Identify high-probability trade setups
✅ Understand market sentiment
✅ Time your entries and exits with precision
To learn more in-depth about Master Candlestick Patterns in Trading, please check the following video on our YouTube channel.
In this article, I explain how to Master Candlestick Patterns in trading. I hope you enjoy this article and gain a deeper understanding of Mastering Candlestick Patterns in Trading. Please join my Telegram Channel, YouTube Channel, and Facebook Group to learn more and clear your doubts.
