
Back to: Data Science Tutorials
Feature Selection Case Study in Data Science
In this article, I am going to discuss one Feature Selection Case Study in Data Science with Examples. Please read our previous article where we discussed Feature Selection in Data Science with Examples.
A Feature Selection Case Study
We are about to work on the Pokemon Dataset here for this case study.
Data Description – This dataset includes statistics on all 802 Pokemon from all seven generations of the Pokemon franchise. Base stats, performance against other types, height, weight, classification, egg steps, experience points, abilities, and whether or not a pokemon is legendary are all included in this dataset.
Dataset Link – here
# Import Necessary Libraries
import pandas as pd
import numpy as np
import matplotlib.pyplot as plt
import seaborn as sns
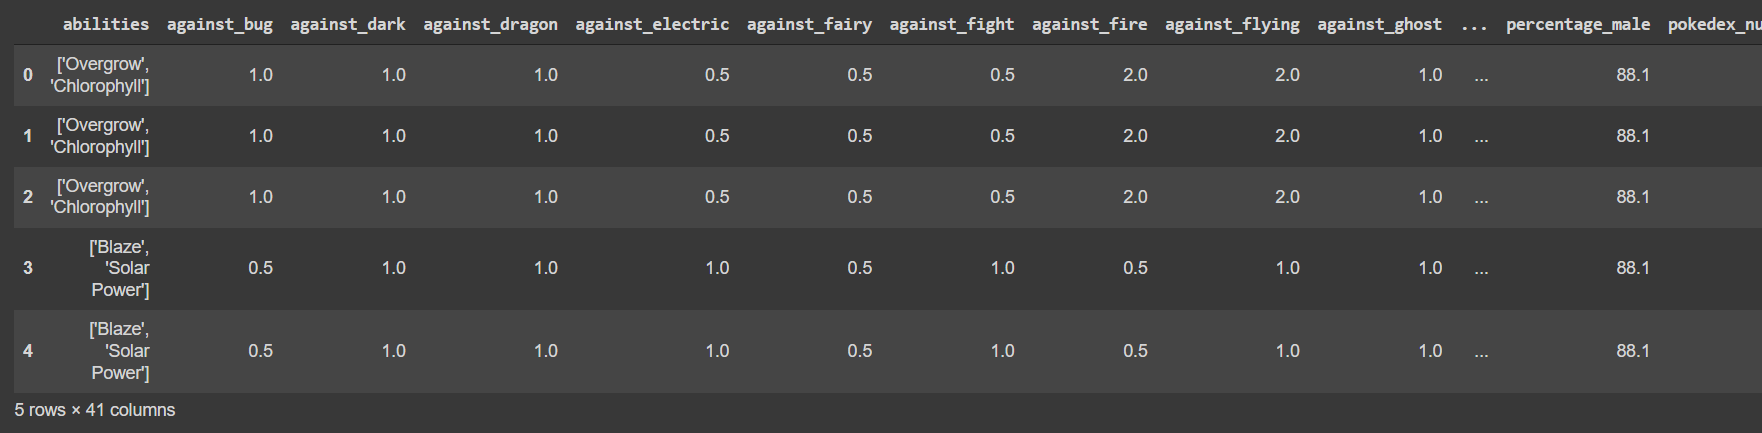
# Import dataset and display first 5 records
df = pd.read_csv('pokemon.csv')
df.head()
Output:
# Let's check the info of dataset
df.info()
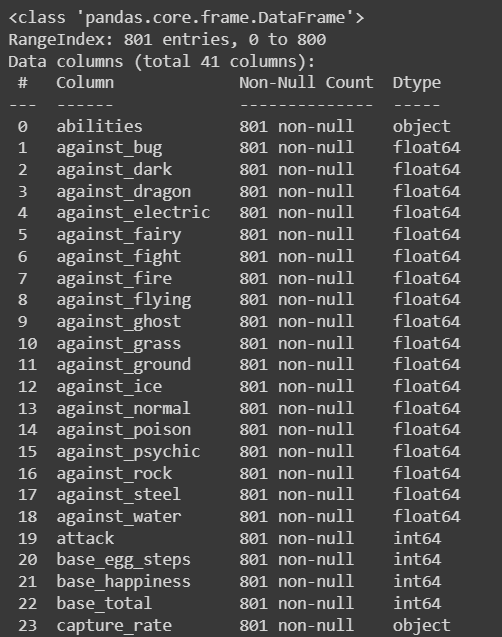

# Conclusion -
# Shape of the dataset - 801 rows, 41 columns
# Numerical Features - 34
# Categorical Features - 7
# Now, let’s check missing data
df.isnull().sum()
# Here we have 1 categorical and 3 numerical features with missing values
# Handling Missing Values - Categorical
df['type2'].fillna('Unknown', inplace=True)
# Handling Missing Values - Numerical
cols = ['height_m','percentage_male','weight_kg']
for c in cols:
  df[c].fillna(df[c].mean(), inplace=True)

# Let's convert the categorical features to numerical
cols = ['abilities','capture_rate', 'classfication', 'japanese_name', 'name', 'type1', 'type2']
from sklearn.preprocessing import LabelEncoder
lb = LabelEncoder()
for c in cols:
  df[c] = lb.fit_transform(df[c])

# Method 1 - Check correlation and drop features with high correlation
plt.figure(figsize=(20, 15))
sns.heatmap(df.corr(), annot=True)
# We will check and drop all the features with correlation greater than 0.8
# creating an empty set for storing correlated features
correlated_features = set()

# creating correlation matrix
correlation_matrix = df.corr()
for i in range(len(correlation_matrix .columns)):
    for j in range(i):
        if abs(correlation_matrix.iloc[i, j]) > 0.8:
            colname = correlation_matrix.columns[i]
            correlated_features.add(colname)
correlated_features
![]()
# Here we can see according to results
# we can drop only 1 feature i.e. generation
df.drop('generation', axis=1, inplace=True)
# Method 2- Now let's check the feature importance
# And drop features accordingly
# Splitting data into test and train sets
from sklearn.model_selection import train_test_split
y = df.pop('is_legendary')
x = df
X_train, X_test, y_train, y_test = train_test_split(x, y, test_size=0.20, random_state=0)

# fitting the model
from sklearn.ensemble import RandomForestClassifier
classifier = RandomForestClassifier(n_estimators=500, n_jobs=-1, random_state=42)
classifier.fit(X_train, y_train)

# plotting feature importances
features = df.columns
importances = classifier.feature_importances_
indices = np.argsort(importances)
plt.figure(figsize=(10,15))
plt.title('Feature Importances')
plt.barh(range(len(indices)), importances[indices], color='b', align='center')
plt.yticks(range(len(indices)), [features[i] for i in indices])
plt.xlabel('Relative Importance')
plt.show()
# Let's keep only top 10 features
all_feat = [features[i] for i in indices]
all_feat = all_feat[::-1]
top_10 = all_feat[:10]
top_10
# drop rest of the features
other_feat = all_feat[10:]
df.drop(other_feat, axis=1, inplace=True)
In the next article, I am going to discuss Data Preprocessing in Data Science with Examples. Here, in this article, I try to explain One Feature Selection Case Study in Data Science with Examples. I hope you enjoy this Feature Selection Case Study in Data Science with Examples article.